CASE STUDY // 04
RFM — The 'Loyal' Customers Who Had Actually Vanished
A synthetic 104-customer dataset run through the RFM engine surfaces a real limitation in composite-score segmentation: twelve high-value customers labeled Loyal, holding more than a third of total revenue, silent for 9 to 15 months, and never flagged as at-risk.
$71,691
Revenue held by 12 customers labeled 'Loyal' — 36.9% of every dollar in the dataset
9–15 mo
How long those same 12 customers had gone silent
0
Times the built-in Churn Risk flag fired for any of them
THE ACTUAL DASHBOARD
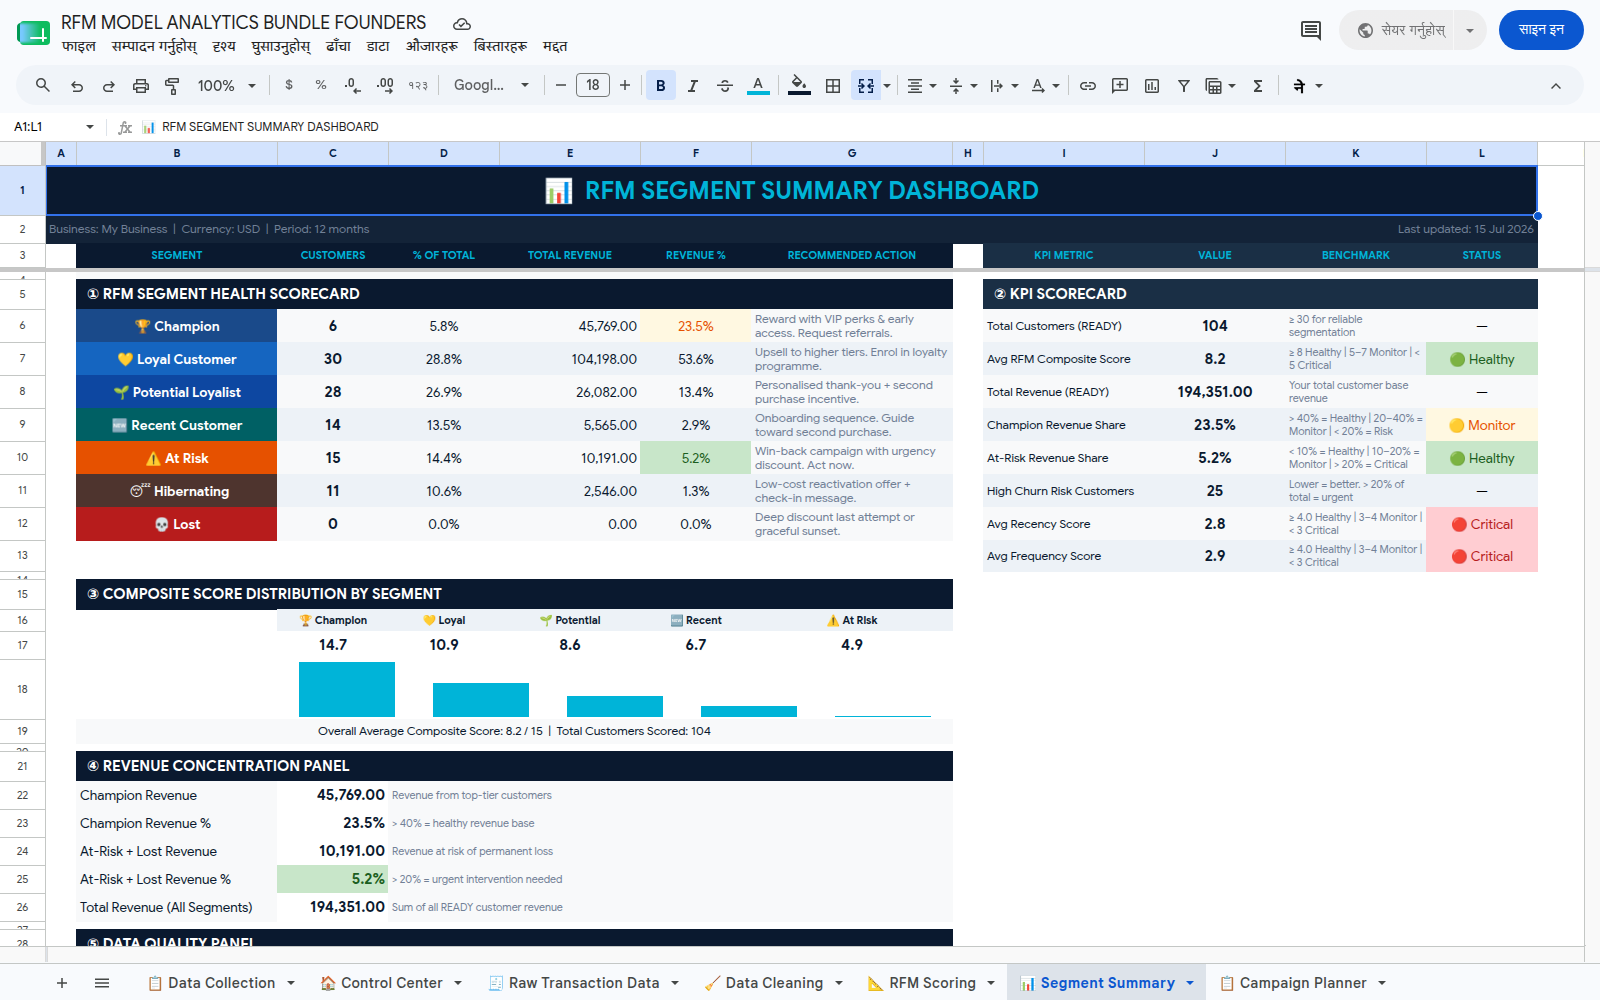
THE PROBLEM
A repeat-purchase business builds a customer list of dozens or hundreds of names but has no ranked view of who is actually worth the next marketing dollar. Every customer gets the same email blast and the same discount code, while a handful of genuinely high-value customers quietly go silent — indistinguishable from everyone else until the revenue is already gone.
THE RESOLUTION
RFM scores every customer on Recency (days since last order), Frequency (total orders), and Monetary (total revenue), each 1-5, from one input row per customer. The three scores sum into a composite that sorts customers into one of 7 segments, and a separate Churn Risk flag is meant to catch anyone slipping away. Built in Google Sheets + Excel VBA — no CRM, no data team.
WHAT THE ENGINE DID
Recency
Scored every customer on days since their last order across a 104-customer synthetic base. A distinct cluster sat at the bottom of the scale — 290 to 449 days silent — despite an otherwise strong order history.
Frequency & Monetary
Scored total orders and lifetime revenue independently of Recency. Twelve of the silent customers scored near-maximum on both — 13 to 22 lifetime orders, $3,700 to $8,900 in revenue each.
Composite Score
Summed all three scores into one number per customer. For the twelve silent-but-historically-strong customers, the dead Recency score got outweighed by maxed-out Frequency and Monetary — composite 10-11, landing squarely in the 'Loyal Customer' band.
Churn Risk Flag
Checked whether the built-in risk flag — designed specifically to catch customers going quiet — fired for this cohort. It did not. The flag only trips when the composite itself is low, and a strong purchase history keeps the composite high enough to stay silent.
THE RESULT
Across the 104-customer set, 12 customers — 11.5% of the base — carry $71,691 in lifetime revenue (36.9% of every dollar in the dataset) and haven't ordered in 9 to 15 months. Every one of them is labeled 'Loyal Customer.' None of them trip the Churn Risk flag. The dashboard's own health scorecard tells the same story from a different angle: the average composite score reads a healthy 8.23, while the average Recency score sits at 2.76 and average Frequency at 2.93 — both in the critical band. The headline number says the customer base is fine; the two components that actually measure whether people are still buying say otherwise. A separate, larger cohort of 25 genuinely low-value customers (about 6% of revenue) is correctly flagged — the tool works exactly as designed there. The gap is specific: a customer's own strong history can outweigh the fact that they left, and the higher that customer's past value, the more effectively their departure gets hidden. The practical fix costs nothing extra — sort by Recency score on its own, especially inside the Loyal and Champion segments, instead of trusting the composite label at face value. Illustrative synthetic data — not a real client result.